
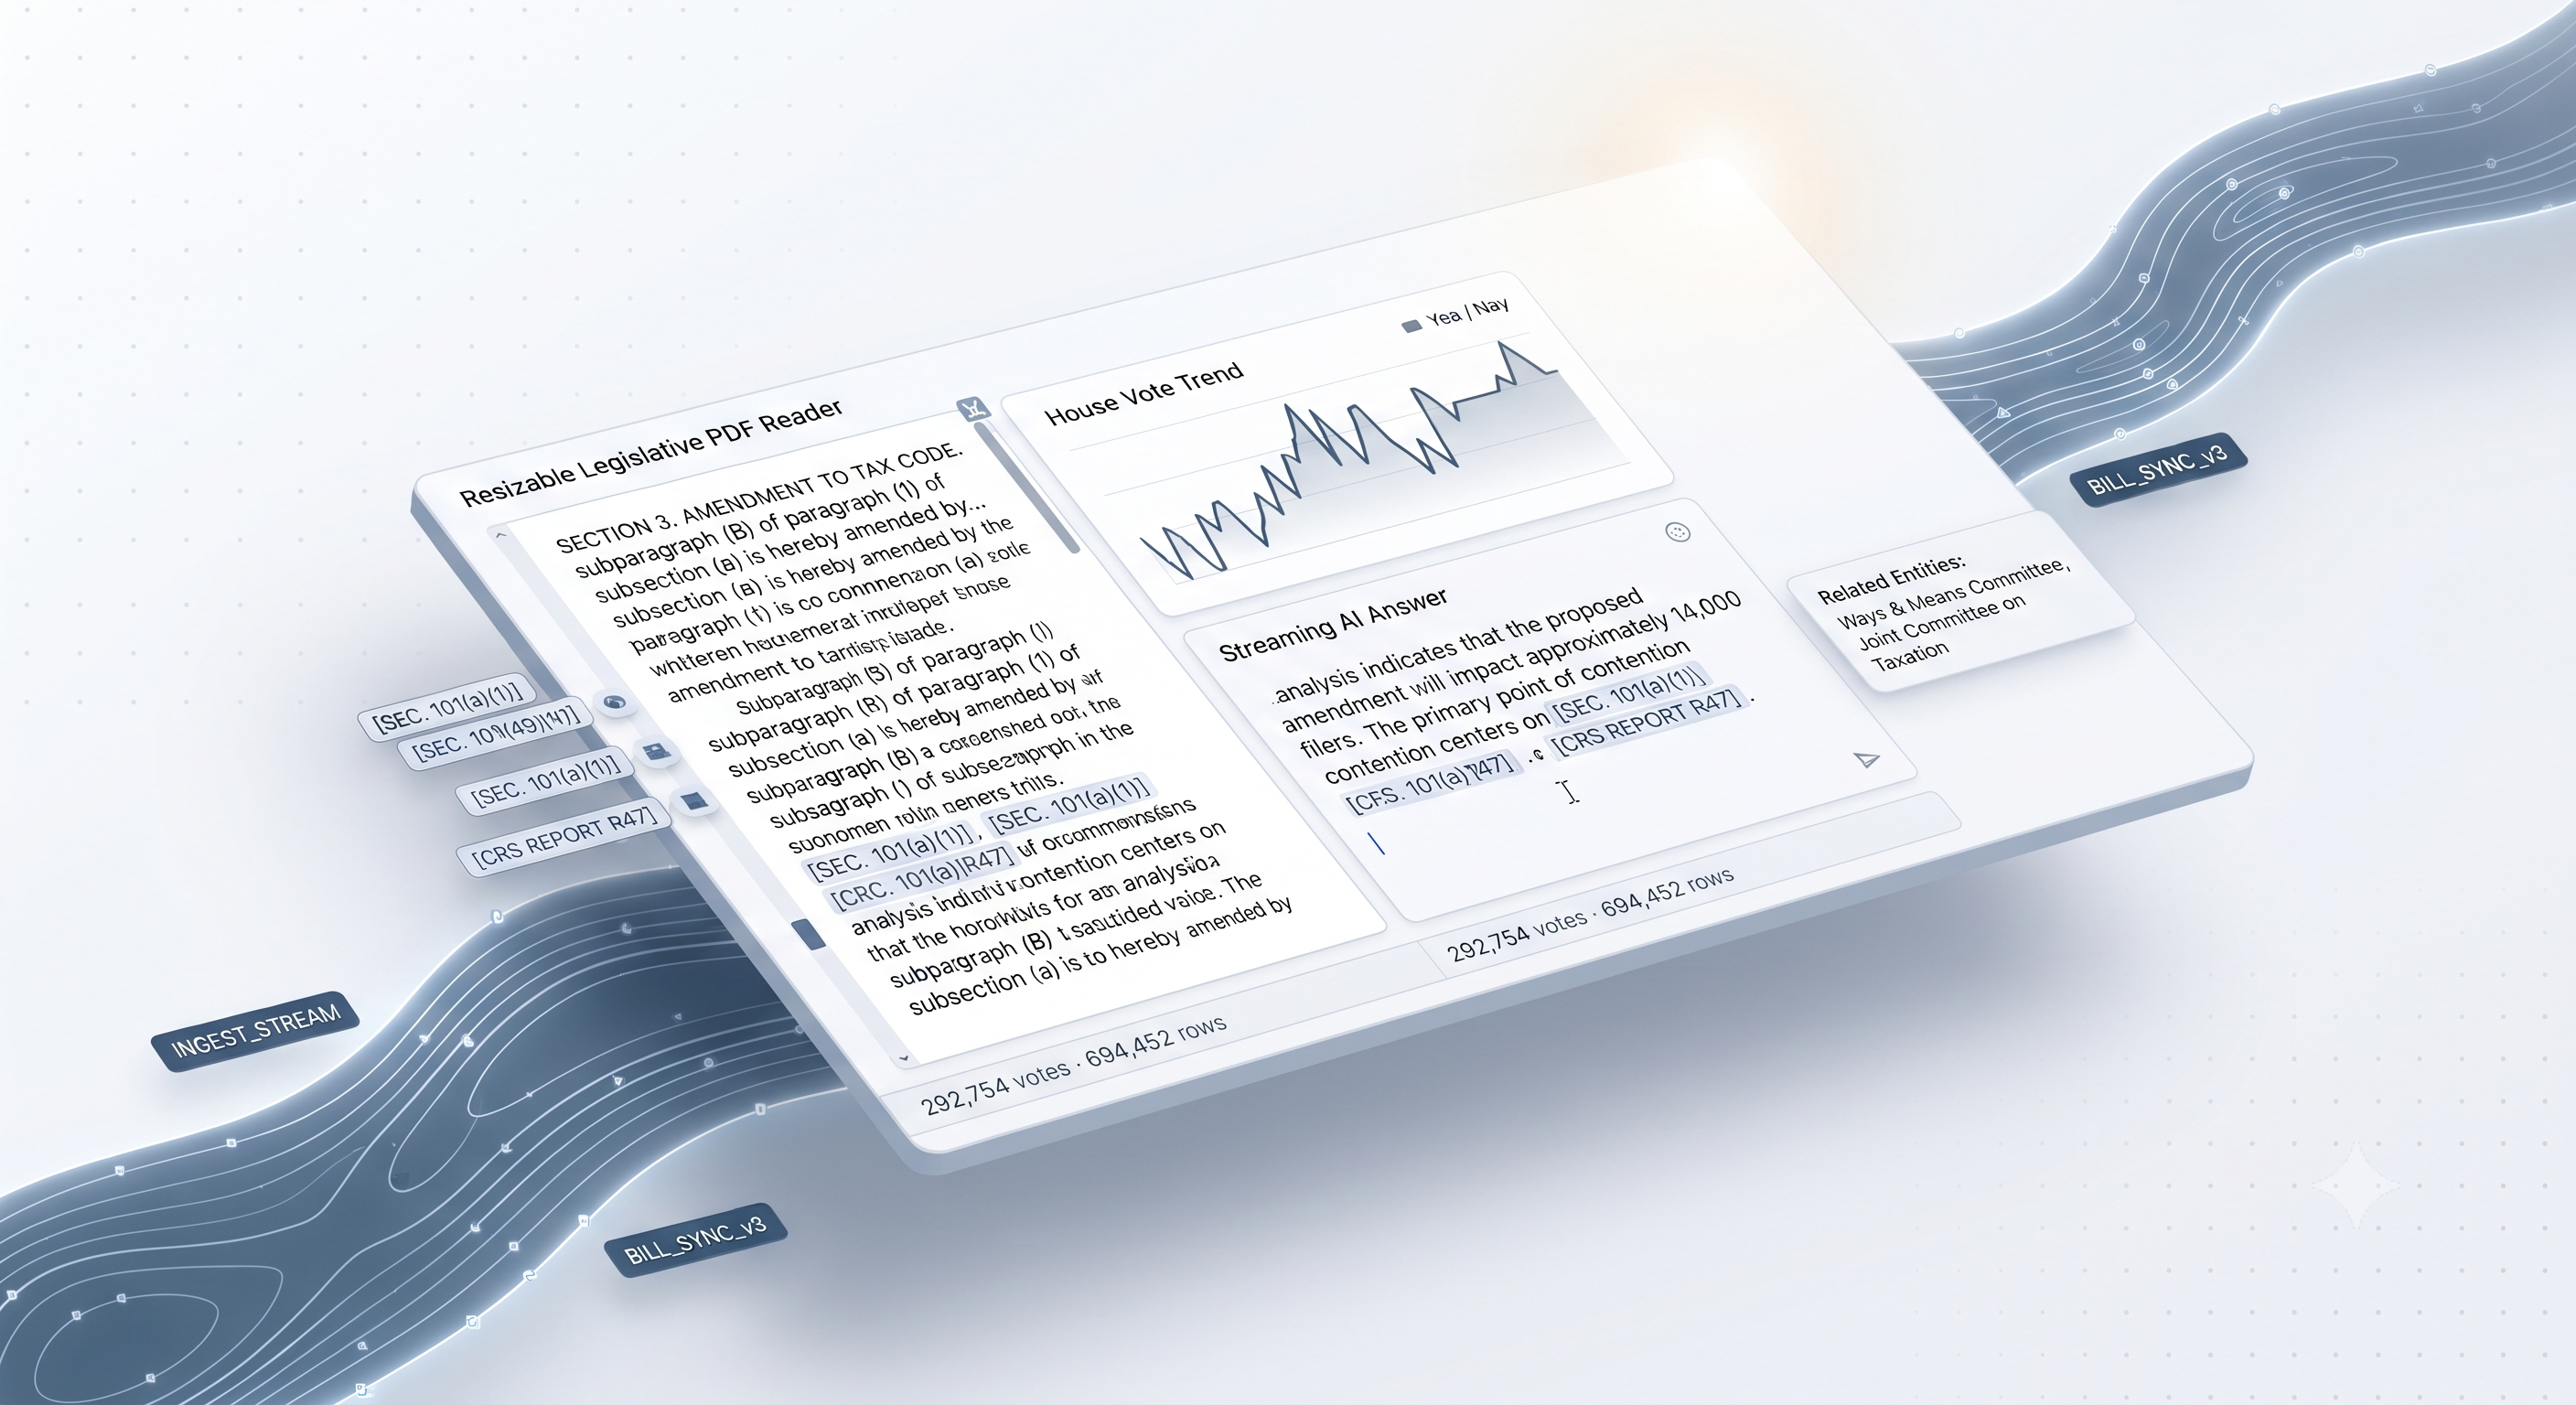
PolicyGPT is a legislative policy portal. You browse bills, members, and committees, read the actual bill text, chart activity, and ask a model questions about a bill with the document in context. The two parts worth walking through are how it reads PDFs and how it handles charts.
Reading the bill text
The bill PDFs come from the NY Senate site, which doesn't send CORS headers and
blocks embedding, so a plain <iframe> won't load them. Rather than punt to a new
tab, PolicyGPT opens the text in a resizable side sheet and tries a few approaches
in order. It builds the PDF URL from the bill number and keeps a Google Docs
viewer around as a fallback:
// src/components/features/bills/BillPDFSheet.tsx
const CORS_PROXIES = [
  "https://corsproxy.io/?",
  "https://api.allorigins.win/raw?url=",
];

const cleanBillNumber = billNumber.toLowerCase().replace(/[^a-z0-9]/g, "");
const sessionYear = bill?.session_id || 2025;
const pdfUrl = `https://legislation.nysenate.gov/pdf/bills/${sessionYear}/${cleanBillNumber}`;
const gviewUrl = `https://docs.google.com/gview?url=${encodeURIComponent(
  pdfUrl
)}&embedded=true`;
First it fetches the PDF through a proxy into a blob URL, so it can render natively and stay interactive. If that fails, it switches to the Google viewer. If that also fails, it shows an error with a direct download link. The sheet is drag-resizable, so you decide how much room the document gets:
const [sheetWidth, setSheetWidth] = useState(900);
const [isResizing, setIsResizing] = useState(false);
There's also a cleanup step after the sheet closes: it clears a stuck
pointer-events style off document.body. Without it, Radix occasionally left
the whole page un-clickable, which is the kind of bug you only catch in
production.
Inline charts
Bill and member activity render as small recharts sparklines, area or bar depending on the metric, sized to sit next to the text instead of on a separate dashboard:
<ResponsiveContainer width="100%" height="100%">
  <AreaChart data={d.data} margin={{ top: 4, right: 4, bottom: 0, left: 4 }}>
    <Area
      type="monotone"
      dataKey="y"
      stroke={d.color}
      strokeWidth={1.5}
      fill={`url(#${d.id})`}
      dot={false}
      animationDuration={500}
    />
    <XAxis dataKey="x" hide />
  </AreaChart>
</ResponsiveContainer>
The axes are hidden, each series has its own gradient fill, and the animation is short. The goal is a chart you can read at a glance, in line with the text around it, rather than a dashboard you have to go open.
Why it matters
Most "chat with a document" products treat the document as a second-class citizen — a citation, a link out. PolicyGPT treats the PDF as a primary surface that stays open, resizable, and resilient, with charts and chat arranged around it. That stance is what made it the flagship.

Brendan Stanton
Founder, NYSgpt
Read more

SolarGPT — geographic drill-down and reprojected raster overlays
The most map-heavy project in the family: state → county → ZIP drill-down on styled Google Maps, choropleths bound to live KPIs, and solar-flux GeoTIFFs decoded and reprojected to WGS84 in the browser.
ChildcareGPT — turning a 28-page government PDF into a form people can finish
A subsidy application nobody can get through becomes a tabbed, self-validating wizard — and then writes the user's answers back into the official OCFS PDF with pdf-lib, so what comes out is the real, fileable document.
TariffsGPT — a command palette, a real Stripe upgrade, and PDFs that pay you back
Three production-grade pieces: a command palette that navigates, acts, and falls back to the assistant; a Stripe upgrade with a fail-closed mock path; and a customs-form parser that reads a CBP 7501 PDF and computes the refund you're owed.